Federal Reserve (Fed) Chair Jerome Powell gave a significant speech at the annual central bank symposium at Jackson Hole last week in which he laid out the general conclusions of the Fed’s review of its Statement on Longer-Run Goals and Monetary Policy Strategy. That document outlines how the Fed goes about fulfilling its congressionally assigned mandate of stable prices and maximum sustainable employment. The short version of the outcome: The Fed will let inflation run a little hotter than it might have in the past and short-term rates, at least, will be lower for longer.
“Under the Fed’s new guidelines, it may have not raised rates as aggressively in 2017 and 2018,” said LPL Financial Chief Market Strategist Ryan Detrick. “Does that mean President Trump was right that the Fed raised rates too aggressively? Give him his due—his instincts were probably right, although it might have been for the wrong reason.”
The Fed is changing the way it’s looking at inflation. Its target hasn’t changed. It’s still 2%. But rather than aiming to be at 2%, give or take, at any particular moment it’s going to look for something more like an average of 2% over a whole cycle. If inflation runs below that target for a period, it can be allowed to run a little hot as long as there’s a clear path to getting it back to 2% without harming the economy.
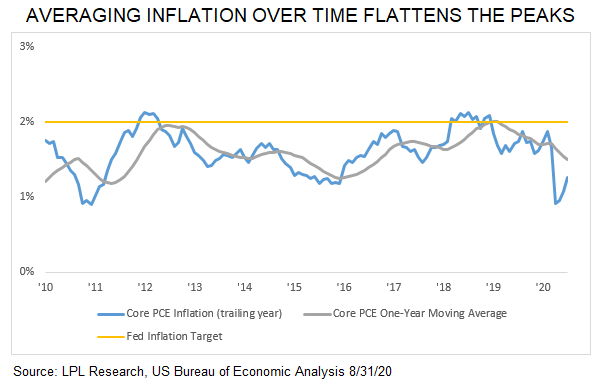
While probably too constrained compared with the policy, in today’s LPL Chart of the Day, we look at the difference that just averaging inflation over one year might have made, using the core version (excluding volatile food and energy prices) of personal consumption expenditure (PCE) inflation, the Fed’s preferred measure.
What difference would have this new goal made? It’s hard to know, since Powell’s Jackson Hole speech was only a preliminary statement on changes in policy, inflation targeting was only one piece, and assessing the economy in real time is more complicated than a backward-looking exercise. Just using a one-year average, inflation would not have even looked like it was reaching the 2% target until 2018, so the Fed almost certainly would have been more restrained. Looking at it from the perspective of the cycle, which is probably closer to the actual policy, from 2008 to 2016, a nine-year period, core PCE averaged just 1.5%, topping 2% only once over a calendar year (2011). That means the Fed might have been comfortable letting inflation run closer to 2.5% for an extended period, and possibly 3% for a few years, before starting to pump the breaks on the economy.
The change seems academic in a way. Why are we talking about the Fed letting inflation run at 2.5 or 3% if the Fed hasn’t been able to get it up to 2%? The key, though, is it changes expectations, and inflation expectations actually have a meaningful impact on realized inflation. It also helps signal that the Fed is likely to keep rates low for an extended period, delaying speculation about prospective rate hikes until the economy is solidly standing on its own two feet. So yes, if this policy were in place the Fed probably would not have raised rates in 2015, or 2016, and might not have in 2017 or 2018. The downside to all that? With rates lower for longer, the Fed potentially blunts one of its most important policy tools, its ability to lower rates in future economic slowdowns.
Do you have a written financial plan to grow your net worth and protect your retirement? Set up a consult to get a financial plan and advice you can understand.
[/fusion_text]
IMPORTANT DISCLOSURES
This material is for general information only and is not intended to provide specific advice or recommendations for any individual. There is no assurance that the views or strategies discussed are suitable for all investors or will yield positive outcomes. Investing involves risks including possible loss of principal. Any economic forecasts set forth may not develop as predicted and are subject to change.
References to markets, asset classes, and sectors are generally regarding the corresponding market index. Indexes are unmanaged statistical composites and cannot be invested into directly. Index performance is not indicative of the performance of any investment and do not reflect fees, expenses, or sales charges. All performance referenced is historical and is no guarantee of future results.
Any company names noted herein are for educational purposes only and not an indication of trading intent or a solicitation of their products or services. LPL Financial doesn’t provide research on individual equities. All information is believed to be from reliable sources; however, LPL Financial makes no representation as to its completeness or accuracy.
This Research material was prepared by LPL Financial, LLC.
Securities and advisory services offered through LPL Financial (LPL), a registered investment advisor and broker-dealer (member FINRA/SIPC).
Insurance products are offered through LPL or its licensed affiliates. To the extent you are receiving investment advice from a separately registered independent investment advisor that is not an LPL affiliate, please note LPL makes no representation with respect to such entity.
If your representative is located at a bank or credit union, please note that the bank/credit union is not registered as a broker-dealer or investment advisor. Registered representatives of LPL may also be employees of the bank/credit union.
These products and services are being offered through LPL or its affiliates, which are separate entities from, and not affiliates of, the bank/credit union. Securities and insurance offered through LPL or its affiliates are:
- Not Insured by FDIC/NCUA or Any Other Government Agency
- Not Bank/Credit Union Guaranteed
- Not Bank/Credit Union Deposits or Obligations
- May Lose Value
For Public Use | Tracking # 1-05047946

