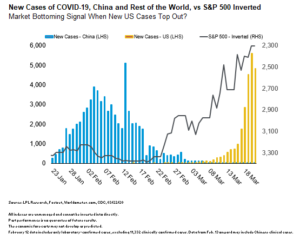
As COVID-19-related fear continues grip global financial markets, we wanted to take a closer look at factor #1 in our Road to Recovery Playbook: confidence in the timing of a peak of new COVID-19 cases in the United States.
This is probably the most difficult signal in the playbook to call with any degree of certainty. We can look to data from countries that were affected earlier for clues, but many country-specific factors contribute to the outcomes, e.g., societal norms (such as greeting with a kiss in Italy), population density, age distributions, prevalence of preexisting health conditions, smoking rates, air pollution, availability of testing equipment and criteria for administering tests, the compositions of economies, severity and speed of local governments’ containment measures, and even weather.
The good news is that despite the wide range of factors, the number of COVID-19 cases so far has conformed to Farr’s Law of Epidemics, exhibiting a somewhat predictable bell curve normal-like distribution. Formulated in the 1800s by British epidemiologist Dr. William Farr, these laws predict that epidemics normally follow a pattern of sharp increase, a peak, and then a decline back to a baseline. The distributions of both new COVID-19 cases and related fatalities in China and South Korea have exhibited this behavior and appear to have ridden out the initial outbreak cycle. The City of Wuhan, China, which was the initial epicenter for the virus, reported on March 19 that it had zero new cases—showing us that the curve can be flattened and there is light at the end of the tunnel.
The bad news is that countries now in the midst of outbreaks, including the United States, remain on the upward slope of the curve where the modified human behaviors predicted by Farr’s law, including social distancing, lockdowns, and treating the sick, have either yet to be fully implemented or have yet to take effect. Italy and Iran had the first outbreaks outside of Southeast Asia and appear to be further along in the curve than Spain, France, Germany, the UK, and the US. Growth of new cases in the US may be beginning to stabilize, after hitting what may or may not have been a peak on March 20. We must consider that the tougher containment measures implemented in many states may not have had enough time for the desired impacts.
As shown in the LPL Chart of the day, the S&P 500 Index has continued to drop as the daily numbers of new COVID-19 cases in the US has grown (note that the scale of the S&P 500 line in the chart has been inverted).
“While markets clearly reflect a lot of fear right now, we have reason to believe the improving patterns of infection seen in China and South Korea will be repeated in the other countries that now find themselves with major outbreaks,” said LPL Financial Senior Market Strategist Ryan Detrick. “While the nearly unprecedented level of volatility we are experiencing in stocks is historic, there is some light at the end of the tunnel.”
We will get through this and the market will find its bottom. We have no doubt. The US economy came into this crisis on a strong footing, which should help it weather the storm. The fiscal response will reportedly be massive and unprecedented, which should help preserve jobs and position the US economy for a stronger recovery on the other side of this. We think long-term investors may be rewarded for sticking with their target allocations through this crisis and would recommend staying the course. There may be emerging opportunities for suitable investors to consider opportunistically – but thoughtfully and carefully – adding some risk to portfolios in the weeks ahead.
Be well. Contact me if you have any questions or concerns. I am always right here.
Next Step: Speak to a Financial Advisor
IMPORTANT DISCLOSURES
This material is for general information only and is not intended to provide specific advice or recommendations for any individual. There is no assurance that the views or strategies discussed are suitable for all investors or will yield positive outcomes. Investing involves risks including possible loss of principal. Any economic forecasts set forth may not develop as predicted and are subject to change.
References to markets, asset classes, and sectors are generally regarding the corresponding market index. Indexes are unmanaged statistical composites and cannot be invested into directly. Index performance is not indicative of the performance of any investment and do not reflect fees, expenses, or sales charges. All performance referenced is historical and is no guarantee of future results.
Any company names noted herein are for educational purposes only and not an indication of trading intent or a solicitation of their products or services. LPL Financial doesn’t provide research on individual equities. All information is believed to be from reliable sources; however, LPL Financial makes no representation as to its completeness or accuracy.
This Research material was prepared by LPL Financial, LLC.
Securities and advisory services offered through LPL Financial (LPL), a registered investment advisor and broker-dealer (member FINRA/SIPC).
Insurance products are offered through LPL or its licensed affiliates. To the extent you are receiving investment advice from a separately registered independent investment advisor that is not an LPL affiliate, please note LPL makes no representation with respect to such entity.
If your representative is located at a bank or credit union, please note that the bank/credit union is not registered as a broker-dealer or investment advisor. Registered representatives of LPL may also be employees of the bank/credit union.
These products and services are being offered through LPL or its affiliates, which are separate entities from, and not affiliates of, the bank/credit union. Securities and insurance offered through LPL or its affiliates are:
- Not Insured by FDIC/NCUA or Any Other Government Agency
- Not Bank/Credit Union Guaranteed
- Not Bank/Credit Union Deposits or Obligations
- May Lose Value
For Public Use | Tracking # 1-970330

